
Navigating the complexities of the stock market can feel daunting, especially for beginners. This comprehensive guide, “Understanding the Stock Market: A Beginner’s Guide,” provides a clear and accessible introduction to the world of investing. We’ll demystify key concepts such as stocks, bonds, trading, and risk management, equipping you with the foundational knowledge needed to make informed investment decisions and potentially achieve your financial goals. Learn how to buy stocks, understand market trends, and build a successful investment portfolio.
Stock Market Basics

The stock market is a place where shares of publicly traded companies are bought and sold. These shares, or stocks, represent ownership in a company. When you buy stock, you become a shareholder, owning a tiny piece of that company.
Companies issue stock to raise capital for expansion, operations, or other initiatives. Investors buy stock hoping its value will increase, allowing them to sell it later for a profit (capital gains). They may also receive dividends, which are payments from the company’s profits.
The stock market is made up of different exchanges, such as the New York Stock Exchange (NYSE) and the Nasdaq. These exchanges provide a platform for buying and selling stocks. The price of a stock fluctuates based on supply and demand, influenced by factors like company performance, economic conditions, and investor sentiment.
Investing in the stock market involves risk. Stock prices can go down as well as up, and you could lose some or all of your investment. Understanding basic financial concepts and conducting thorough research before investing is crucial.
There are various ways to invest in the stock market, including buying individual stocks, investing in mutual funds or exchange-traded funds (ETFs) which diversify your investment across multiple companies, and using brokerage accounts to facilitate transactions.
How Stocks are Traded
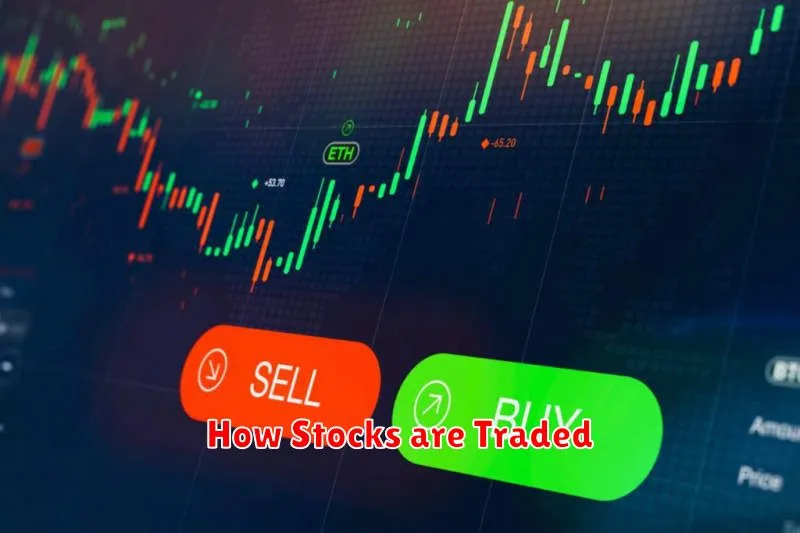
Stocks are traded on stock exchanges, which are marketplaces where buyers and sellers can connect to trade shares of publicly listed companies. These exchanges, such as the New York Stock Exchange (NYSE) and Nasdaq, provide a regulated environment for trading.
The trading process generally involves brokers who act as intermediaries between buyers and sellers. Investors place orders through their brokers, specifying the stock, quantity, and price they are willing to pay (buy orders) or receive (sell orders).
There are two main types of orders: market orders, which are executed at the best available price immediately, and limit orders, which are executed only when a specified price or better is reached. The execution of these orders depends on the supply and demand for the stock at any given moment.
Order matching systems on the exchanges automatically match buy and sell orders at the best available prices. Once a match is found, the trade is executed, and the ownership of the stock is transferred.
The price of a stock fluctuates constantly based on supply and demand, influenced by factors such as company performance, news events, and overall market sentiment. Understanding these price fluctuations is a key aspect of successful stock trading.
Types of Stocks and Their Benefits
Understanding the different types of stocks is crucial for successful investing. Common stock, also known as ordinary shares, represents ownership in a company and offers voting rights, but dividends are not guaranteed. Preferred stock, conversely, typically pays a fixed dividend and takes precedence over common stock in the event of liquidation, but usually lacks voting rights. These stocks offer different risk-reward profiles.
Growth stocks are shares in companies expected to grow at above-average rates, often reinvesting profits back into the business rather than paying large dividends. Value stocks, in contrast, are shares in companies considered undervalued by the market, often offering higher dividend yields and representing a potentially less volatile investment. The potential benefits of growth stocks include substantial capital appreciation, while value stocks can provide a steady income stream and price stability.
Blue-chip stocks are shares of large, well-established, and financially sound companies known for their consistent performance and reliability. Investing in blue-chip stocks generally offers stability and lower risk, but the potential for high growth might be limited compared to smaller companies. Income stocks prioritize dividend payments over significant capital appreciation, making them attractive to investors seeking regular income. They offer a steady stream of passive income, but capital gains potential may be lower than other stock types.
Ultimately, the best type of stock for an investor depends on their individual financial goals, risk tolerance, and investment timeline. A diversified portfolio encompassing various stock types is generally recommended to mitigate risk and maximize potential returns.
Fundamental vs. Technical Analysis
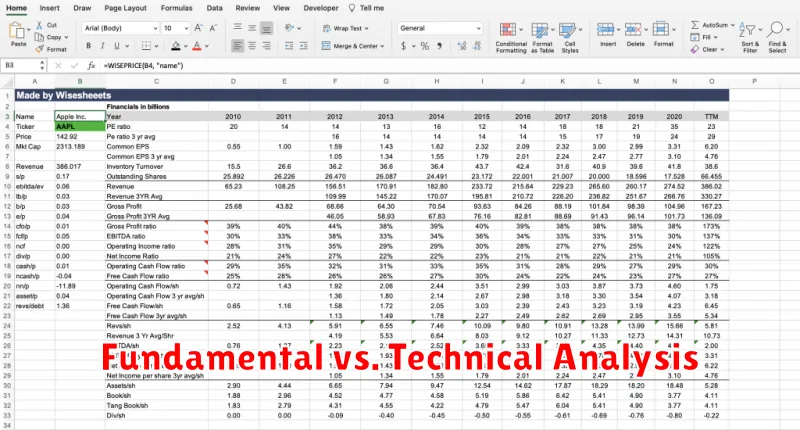
Fundamental analysis focuses on a company’s intrinsic value. It examines factors like financial statements (income statement, balance sheet, cash flow statement), management quality, competitive landscape, and industry trends to determine whether a stock is undervalued or overvalued. The goal is to identify companies with strong fundamentals that are likely to experience long-term growth.
Technical analysis, conversely, focuses on price and volume patterns to predict future price movements. It utilizes charts and indicators to identify trends, support levels, and resistance levels. Technical analysts believe that past price movements can predict future price movements, disregarding fundamental factors. They seek to identify optimal entry and exit points for trading based on chart patterns and indicators.
While seemingly disparate, both approaches can be used in conjunction. Some investors use fundamental analysis to identify promising companies and then employ technical analysis to time their entry and exit points. Ultimately, the choice between these methods depends on an investor’s individual trading style, risk tolerance, and investment horizon.
How to Read Stock Charts
Stock charts visually represent a stock’s price movements over time. Understanding how to read them is crucial for making informed investment decisions. The most common chart type is the line chart, which shows the closing price of a stock each day, connecting the points to create a line illustrating price trends.
Candlestick charts provide more information than line charts. Each “candle” represents a specific period (e.g., a day). The body of the candle shows the opening and closing prices, while the wicks (lines extending above and below the body) illustrate the high and low prices for that period. A green or white candle indicates a closing price higher than the opening price (an up day), while a red or black candle signifies a closing price lower than the opening price (a down day).
Bar charts are similar to candlestick charts but use bars instead of candles. The bar’s height represents the price range for the period, while the tick marks on the left and right sides of the bar indicate the opening and closing prices respectively. The high and low are indicated by the top and bottom of the bar itself.
Key elements to observe on any chart include the price axis (showing price levels), the time axis (showing the period covered, such as days, weeks, or months), volume (the number of shares traded, often shown below the price chart), and trendlines (lines drawn to highlight upward or downward price movements). Analyzing these elements helps identify potential support and resistance levels (price points where the stock’s price has historically struggled to break through).
While charts are valuable tools, they shouldn’t be the sole basis for investment decisions. Always conduct thorough research and consider other factors, such as a company’s financial performance and industry trends, before investing.
Managing Risk in Stock Trading
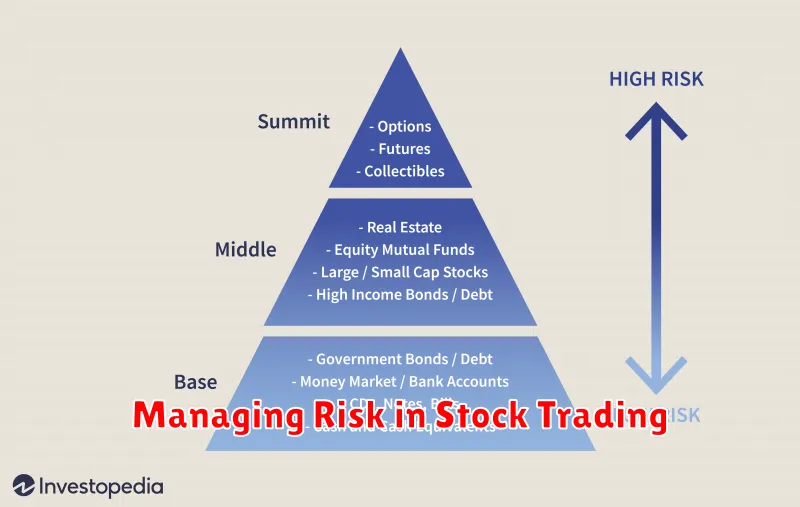
Successful stock trading involves understanding and managing risk. This is crucial because the stock market is inherently volatile, meaning prices fluctuate constantly. Without proper risk management, even well-researched investments can lead to significant losses.
A key strategy is diversification. Don’t put all your eggs in one basket. Spreading your investments across different stocks, sectors, and asset classes reduces the impact of any single investment performing poorly.
Position sizing is another critical aspect. This refers to determining how much capital to allocate to each trade. Never invest more than you can afford to lose. A common rule of thumb is to limit individual positions to a small percentage of your overall portfolio, typically no more than 5-10%.
Stop-loss orders are valuable tools. These orders automatically sell a stock when it reaches a predetermined price, limiting potential losses. Setting stop-loss orders requires careful consideration, as poorly placed ones can trigger premature exits from profitable trades.
Regular review and adjustment of your portfolio are vital. Market conditions change, and your investment strategy should adapt accordingly. Periodically assess your holdings and make adjustments based on your risk tolerance and financial goals.
Finally, education and continuous learning are essential components of risk management. Stay informed about market trends, economic factors, and company news to make informed investment decisions. Understanding your personal risk tolerance is also paramount.
Stock Market Trends to Watch
Understanding market trends is crucial for navigating the stock market. Beginners should focus on a few key indicators.
Economic indicators like inflation rates, unemployment figures, and GDP growth significantly impact stock prices. High inflation, for example, can lead to decreased consumer spending and lower stock valuations.
Interest rates set by central banks influence borrowing costs for businesses and consumers. Rising interest rates generally make borrowing more expensive, potentially slowing economic growth and impacting stock performance. Conversely, lower rates can stimulate the economy.
Geopolitical events can create significant market volatility. International conflicts, political instability, and policy changes can all influence investor sentiment and stock prices.
Sector-specific trends are also important. Certain industries may outperform others based on technological advancements, changing consumer preferences, or regulatory shifts. Keeping abreast of sector performance is crucial.
Technological advancements drive innovation and can create new investment opportunities while simultaneously disrupting established industries. Staying informed about technological trends is essential for identifying promising investments.
By monitoring these key trends, beginners can gain a better understanding of the market’s dynamics and make more informed investment decisions. Remember that past performance does not guarantee future results.
Long-Term vs. Short-Term Investing
The stock market offers two primary investment horizons: long-term and short-term. Each approach carries distinct characteristics and risk profiles.
Long-term investing typically involves holding investments for several years, even decades. This strategy aims to benefit from the long-term growth of companies and the overall market. It generally entails lower risk than short-term investing due to the ability to weather market fluctuations. Buy-and-hold strategies are a common example.
Short-term investing, conversely, focuses on profiting from price fluctuations over shorter periods, such as days, weeks, or months. This approach demands more active management and carries significantly higher risk. Success hinges on accurately predicting market movements, which is inherently difficult.
The choice between long-term and short-term investing depends heavily on individual risk tolerance, financial goals, and investment timeline. Long-term investors prioritize consistent growth and are less concerned with daily market volatility. Short-term investors seek quicker returns but accept the possibility of substantial losses.